Monitoring: all your systems at a glance
Monitoring helps maintain the performance and availability of your systems and detect underlying problems before they have an adverse effect.

Business Impact Analysis (BIA)
A process analysis helps to identify which systems are important and to determine measures in the event of failures or when limit values are reached.
Configuration planning
We analyze your services and propose measurement objectives and performance indicators.
Monitoring setup
We implement systems, measurements and alarms.
Maintenance and support
Continuous improvement of your monitoring and regular reporting along with emergency drills ensure smooth operation.
Perfectly tuned open source solution
Good monitoring alerts you to acute failures and helps to identify performance problems and trends at an early stage and to initiate appropriate measures before your business operations suffer as a result. With our open source tools and comprehensive know-how, we are here to support you in implementing a solution perfectly tailored to your needs. Using powerful, open-source software, of course.
Let’s talk about your environment
Preparation
Process mapping and business impact analysis (BIA)
A business impact analysis (BIA) helps determine which measures are to be taken in the event of failures or when limit values are reached. It helps yur IT and us to understand which processes are particularly important in your company and which IT systems are involved.
Defining measurement goals
Setting up a monitoring system starts with defining measurement goals and KPIs (Key Performance Indicators). Important KPIs are, for example, server load, bandwidth usage, service response times or the number of incorrect requests.
The next step is selecting suitable tools for collecting the data. At foundata we rely on proven open source tools such as Monit, Zabbix and Prometheus. These tools provide a variety of data collection, analysis and alerting capabilities and can be customized to meet the unique needs of your organization.
Software
We use different software depending on the application, also in combination depending on the environment.
Monit
Monit is a lightweight, uncluttered open-source tool specifically designed for monitoring Unix and Linux systems. It’s easy to configure, offers a simple user interface, and can monitor a wide range of system parameters, including CPU usage, disk space, process states, and network activity. If problems are detected, Monit can automatically perform predefined actions, such as restarting services or notifying administrators.
Because of its simplicity, we like to use it at the beginning of administration (e.g. after taking on a new customer) and as a fallback system for monitoring other more complex monitoring services.
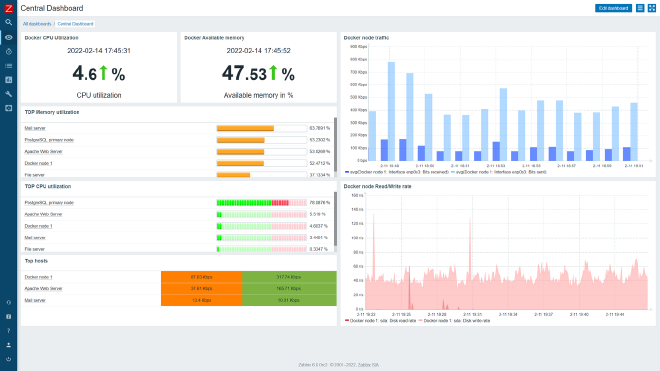
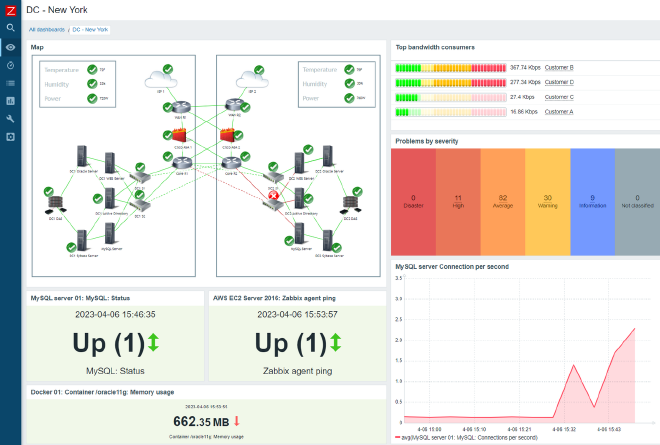
Zabbix
![]()
Zabbix is a comprehensive open source monitoring system suitable for both small and large IT environments. It can monitor a wide range of IT components including networks and servers. With its powerful functions for data visualization and alarms, its flexible and scalable architecture and its support for a large number of target systems, Zabbix is one of the most well-known monitoring systems in the system house and SME environment alongside Nagios.
We primarily use Zabbix to monitor hardware (network switches, printers, server hardware) via SNMPv3 and Microsoft Windows Server VMs.
Prometheus and Grafana
![]()
Prometheus is a powerful, open-source monitoring and alarm system that is particularly well suited for monitoring containerized and cloud environments. It queries real-time metrics from applications via HTTP and records them in a Time Series Database (TSDB). Prometheus is a graduated project of the Cloud Native Computing Foundation.1
Grafana is an open-source, cross-platform web application for analytics and interactive visualization. It displays charts, graphs and alerts based on the connected data sources.
Prometheus and Grafana are considered the de facto standard monitoring system for Kubernetes. OpenShift has also integrated Prometheus for internal monitoring.
A project of the Linux Foundation to promote cloud computing, microservices and container virtualization, in which over 500 manufacturers and operators have joined forces, including Amazon Web Services, Apple, Google, Twitter, Microsoft, RedHat and VMware. ↩︎